METHODOLOGY
What is the Digital Development Compass?
The Digital Development Compass (the Compass) is a comprehensive visualisation of a country's digital indicators, based on publicly available datasets. By examining the Compass, each country can identify their strengths and weaknesses and assess their digital ‘maturity stage.’ The tool features various visualization options, displays the percentage of available data, and enables comparisons between regions, sub-regions and income groups. This user-friendly format allows users to obtain a snapshot of a country's digital readiness without the need to consult multiple sources.
Moreover, the tool serves as a catalyst for conversations between governments and UNDP. It opens the door for discussions about potential discrepancies in rankings or the potential impacts of digital technologies on specific sectors or development plans. Thus, the Compass acts as both a diagnostic framework and a starting point for deeper collaboration and engagement.
Ultimately, the Compass represents a valuable tool for understanding governments’ current digital landscapes and identifying opportunities for progress and growth. It also encourages governments to share their advancements openly to ensure their digital progress is accurately represented in the Compass.
How should the Compass be used?
The primary objective of the Digital Development Compass is to serve as a prominent entry point for countries to directly connect with UNDP’s Country Offices. Through this platform, Country Offices can promptly generate customized materials that showcase their digital initiatives, capabilities and needs. By providing this dedicated space, the Compass aims to strengthen engagement and collaboration while offering countries an expedient means to explore and leverage UNDP's digital capabilities.
The Digital Transformation Framework
Defining digital development
'Digital transformation' is not a destination, but a journey. It is about using digital and technology to improve the lives and livelihoods of individuals, communities and countries.
UNDP advocates for inclusive, whole-of-society digital transformation. This demands a coordinated approach between government, civil society and the private sector to build ownership, support human-centred design, mitigate risks and establish accountability. To support this strategy, UNDP has developed the Digital Transformation Framework, which covers the most important areas for collaboration to achieve inclusive digital transformation.
Overview of the Digital Transformation Framework
The Compass is constructed based on the inclusive whole-of-society Digital Transformation Framework endorsed by UNDP. The Digital Transformation Framework guides countries towards inclusive digital transformation. Specifically, it enables stakeholders to identify, structure and prioritize their national digital transformation initiatives and agendas effectively.
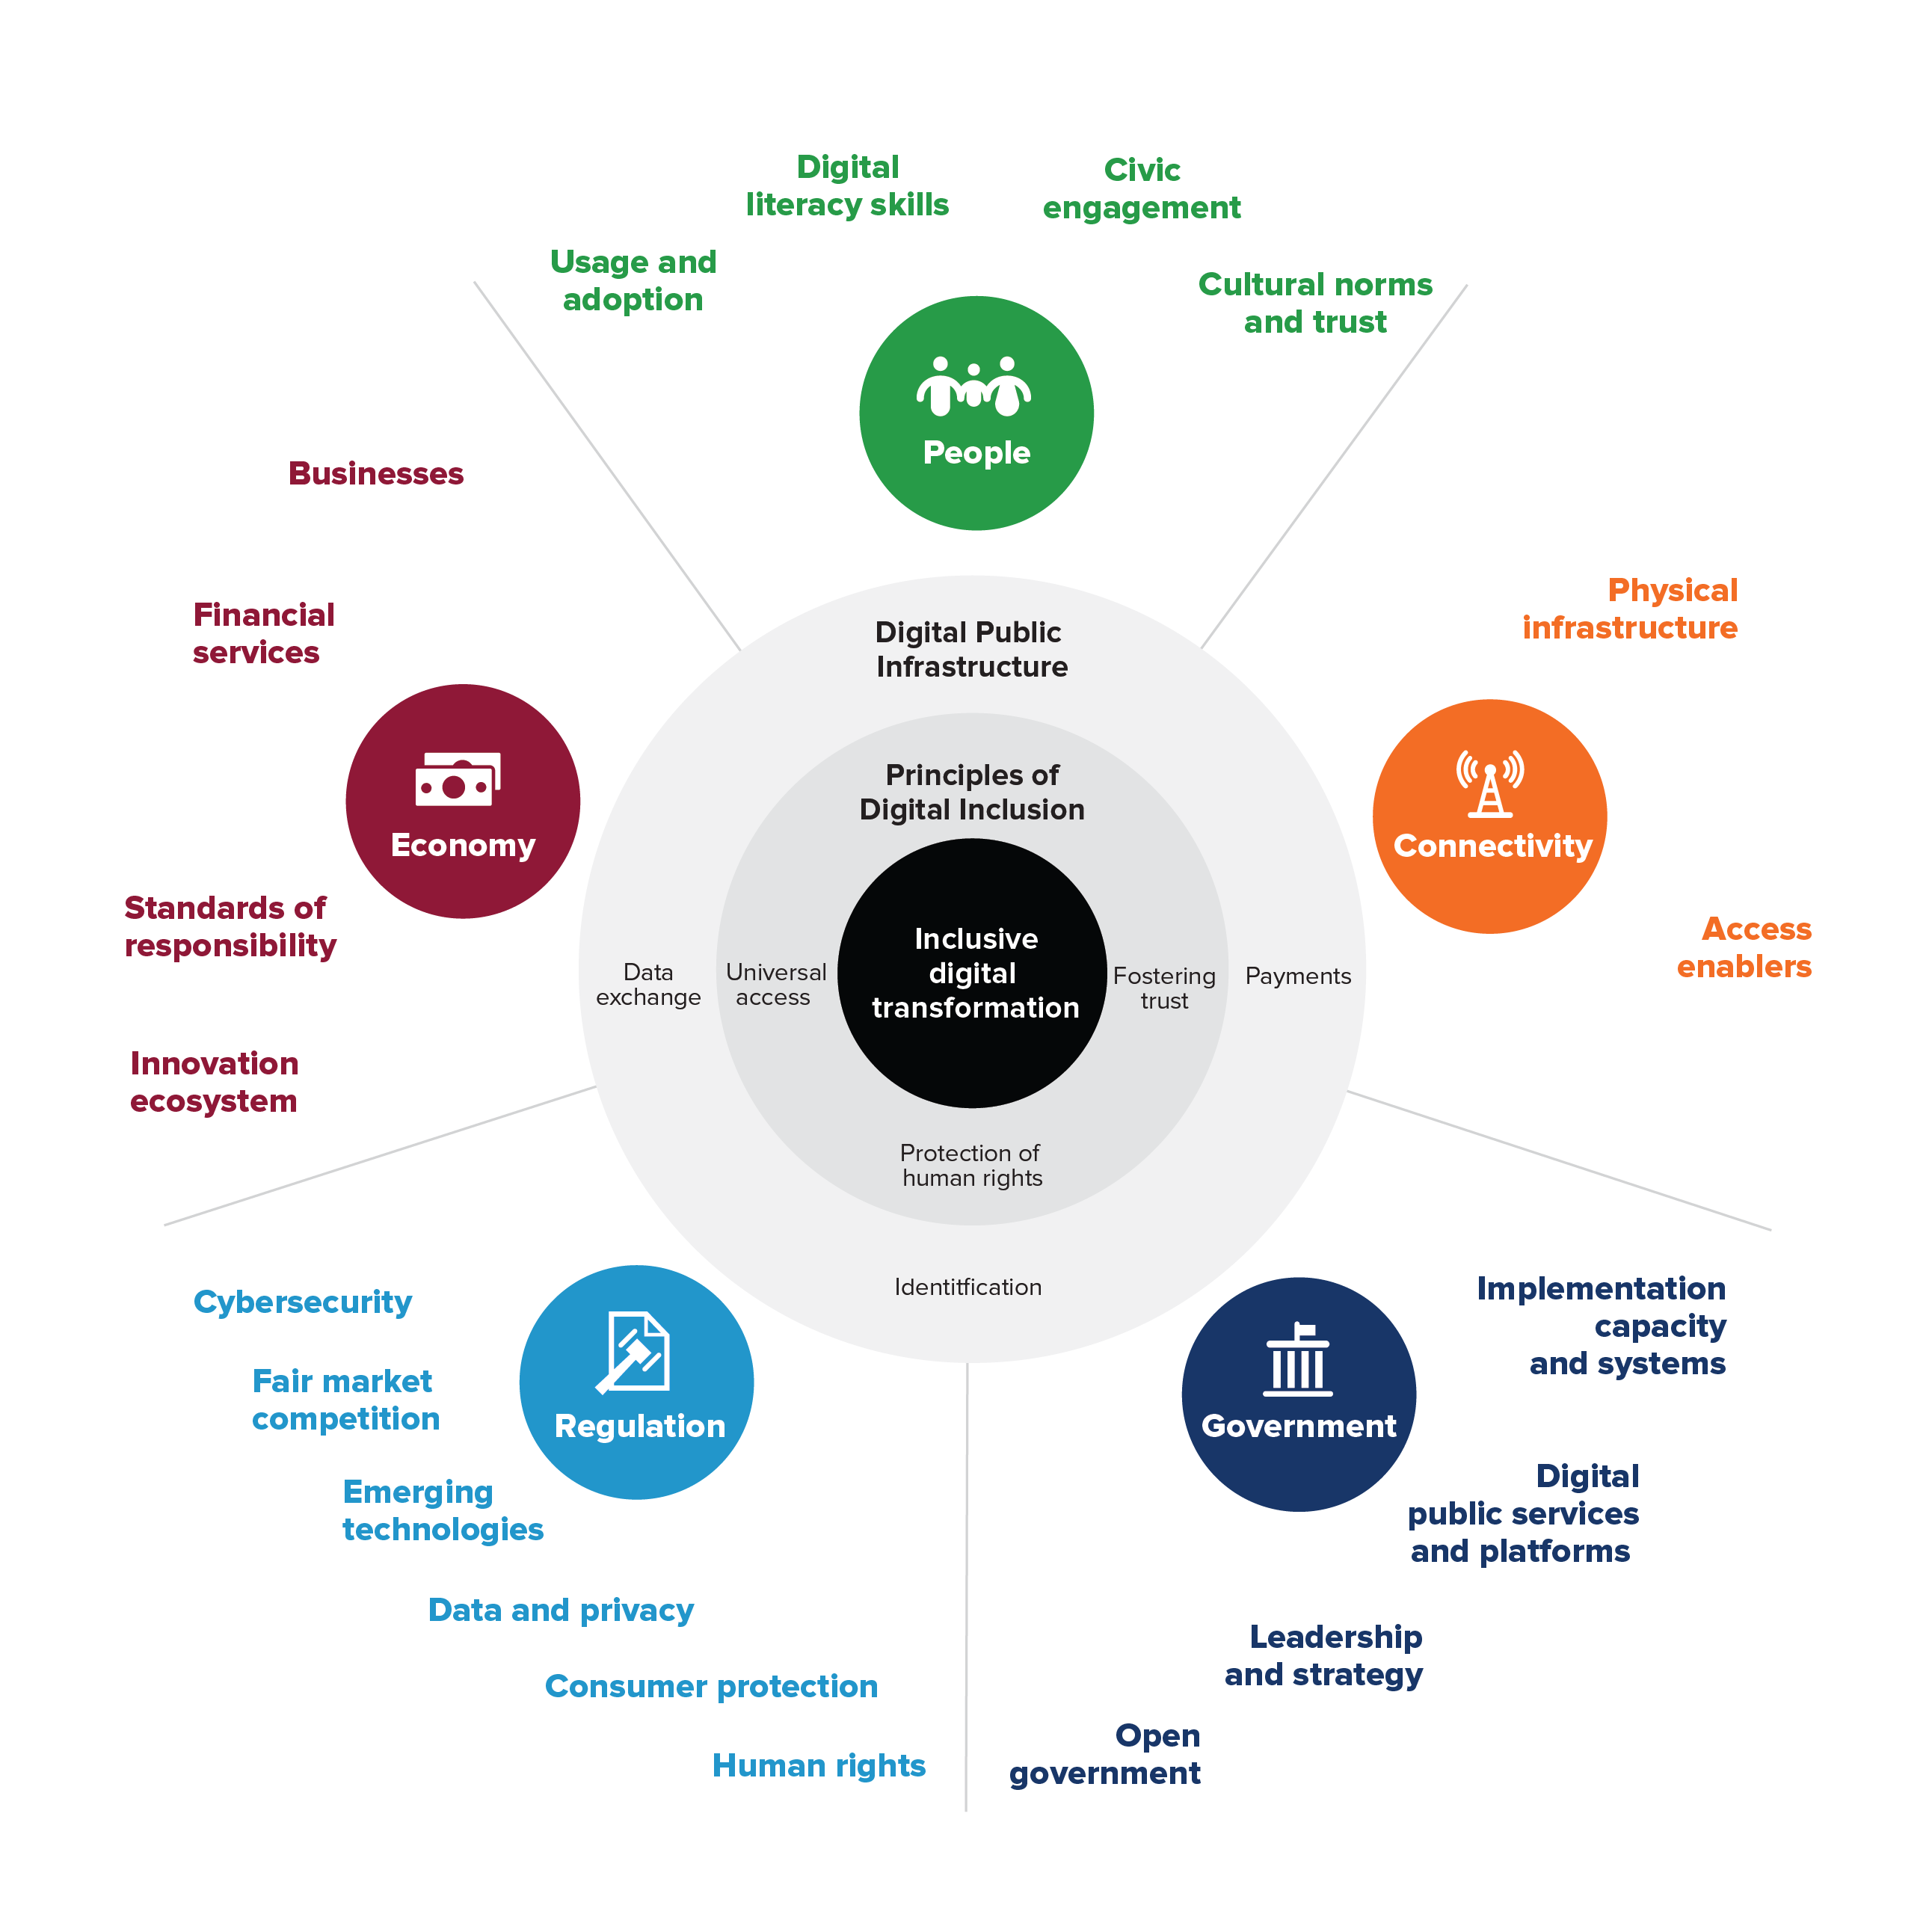
The Digital Transformation Framework is the result of an extensive study that examined various frameworks, implementation strategies and methodologies employed by diverse organizations, including those in the private sector, public sector and international development agencies. The Framework (see Figure 1) is structured around five pillars, with each pillar being further subdivided into 20 sub-pillars such as cyber security and broadband speed. Additionally, the Compass reflects the state of Digital Public Infrastructure (DPI), with 3 sub-dimensions: data exchange, identification and payments. Finally, to score the country’s digital transformation, the Compass evaluates each sub-pillar, using its specific set of indicators.
Through this framework, UNDP aims to provide countries with a valuable resource for assessing and advancing their digital development journey; while considering the unique challenges and opportunities they may encounter along the way.

Figure 1. UNDP’s Digital Transformation Framework
Pillars and sub-pillars
Table 1 provides a list of the pillars and the underlying sub-pillars constituting UNDP’s inclusive whole-of-society Digital Transformation Framework, which form the basis of the Digital Development Compass:
| Pillars | Sub-pillars |
|---|---|
| People |
|
| Connectivity |
|
| Government |
|
| Regulation |
|
| Economy |
|
Table 1. UNDP’s inclusive whole-of-society Digital Transformation Framework: pillars and sub-pillars
Measuring digital development
Stages of digital development
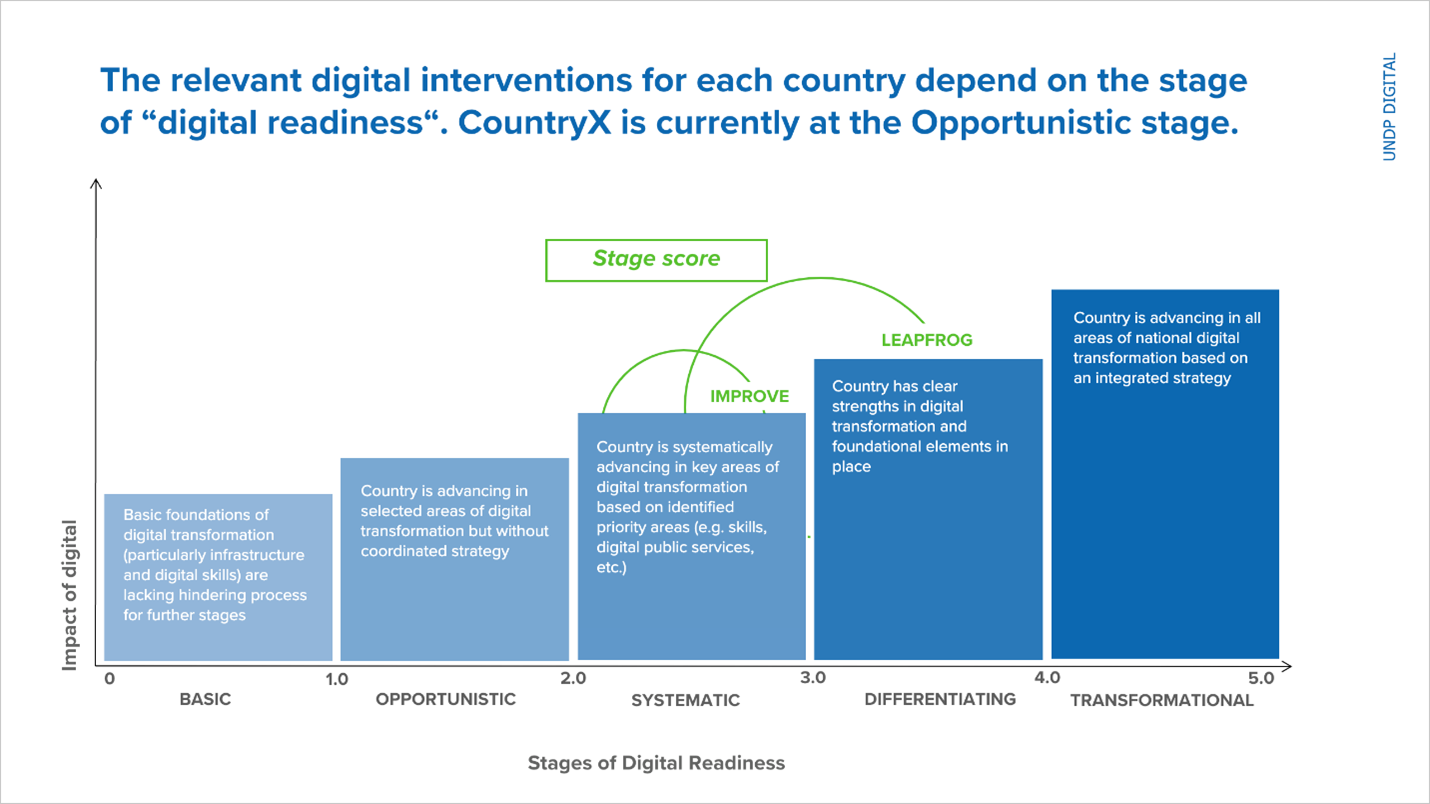
Each country's digital readiness is assessed across five stages of digital development as indicated in Figure 2, which encompasses every pillar and sub-pillar.

Figure 2. UNDP's five stages of digital development
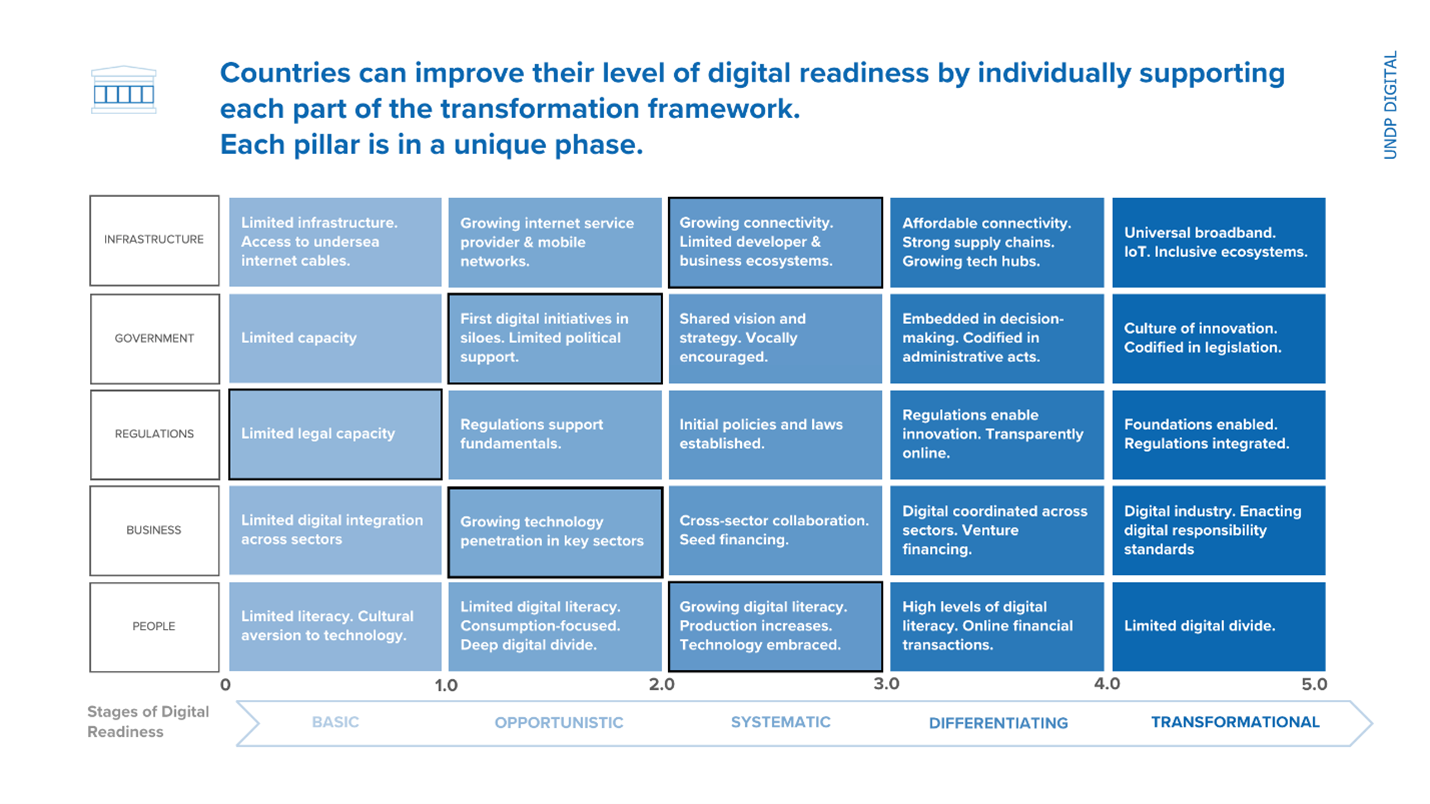
Further enhancement of countries' digital readiness can be achieved by providing individual support to each component of the transformation framework.

Figure 3. Transformation framework
Digital development score methodology
The software and data that are used to put together the Compass are open-source and in the process of becoming Digital Public Goods. The script and datasets can all be found on UNDP’s GitHub , developed in partnership with GitHub’s volunteer programme.
1. Indicator selection
UNDP conducted a review of the 200+ indicators that formed the first version of the Digital Development Compass. This indicator evaluation was carried out in two phases:
- Phase 1: Existing indicators were reviewed according to newly established indicator criteria. A number of composite indexes that were included earlier in the Compass were also exploded to remove instances of double-counting and improve relevancy. The term “exploded” is used, in the sense of ‘to break up into pieces’, to refer to the process of surfacing all of the individual indicators contained within a composite index.
- Phase 2: New indicators were added after the research and review process.
Currently, there are a 145 indicators included in the Compass. Indicators were identified by conducting online desk research into the public data available related to the sub-pillars and pillars of the Digital Development Framework mentioned above.
During this review process, an Expert Committee was appointed, comprising a globally representative group of experts with specialized experience in digital development. The Committee’s vision is to support the Digital Development Compass as it develops year on year. At its core, the Committee will remain flexible, evolving organically and in parallel with the Compass.
Based on a series of advisory consultations with the Expert Committee, questions for data evaluation have been created to assess data quality of all existing and newly selected indicators. In case the examined indicator does not meet the evaluation criteria, the indicator will be excluded from the Digital Development Compass.
| Dimension | Question | Type |
|---|---|---|
| Coverage | Is the data available for more than 70% (135) of 193 countries? | PASS/FAIL |
| Relevance | Is the indicator relevant to the Compass? | PASS/FAIL |
| Is the assigned sub-pillar the most relevant one? | Qualitative judgement | |
| Does the indicator duplicate something already included in the index? | Qualitative judgement | |
| If it is a proxy, is it a good proxy? | Qualitative judgement | |
| Accessibility | Is the dataset publicly accessible? | PASS/FAIL |
| Transparency and replicability | Is there a written, publicly available methodology? | PASS/FAIL |
| Recency | Is the dataset older than five years? | Yes/No |
| Frequency | How frequently is the dataset updated? | Number |
| Reliability | What is the source? | Name + description |
| Is the source reputable? | Qualitative judgement with numerical score 1-3 | |
| Relevance | Does the dataset appropriately capture the intent of the indicator? | Yes/No, with qualitative judgement |
| Reliability | What type of data does it contain? | Primary, secondary, aggregated data |
| Is the methodology robust? - Are variables clear and/or explained? - Does the methodology express its own limitations? - Are there any other concerning factors? | Score 0-9, with sub question scores 0-3 | |
| Ethically sourced (if applicable) | Does the methodology adhere with privacy standards? | PASS/FAIL |
| Appropriateness | Can the data collection process be automated? | Potentially PASS/FAIL. For UNDP to decide |
| Coverage | Does the dataset cover aspects that might be relevant to other indicators/pillars? |
Table 2. Data evaluation questions
As a result of this assessment, Digital Development Compass includes 145 publicly available datasets and is available on GitHub. Sources of the data sets include among others:
- World Bank: World Development Indicators
- GSMA: Mobile Connectivity Index
- University of Oxford: Our World in Data
- World Economic Forum: Global Competitiveness Index
- Sustainable Development Report
- ITU: Global Cybersecurity Index
- Oxford Insights: AI Readiness Index
2. Data collection
The methodology used for data collection depends on the format the data are published in. Largely, data are retrieved from the data source automatically. Links to data sources are collected in a spreadsheet. Then, automation is used to scrape spreadsheets, PDFs and documents and convert them into a machine-readable format.
However, while automation can be applied to most websites from which data are collected, certain platforms require manual intervention. In these cases, files containing data in the correct format are uploaded manually.
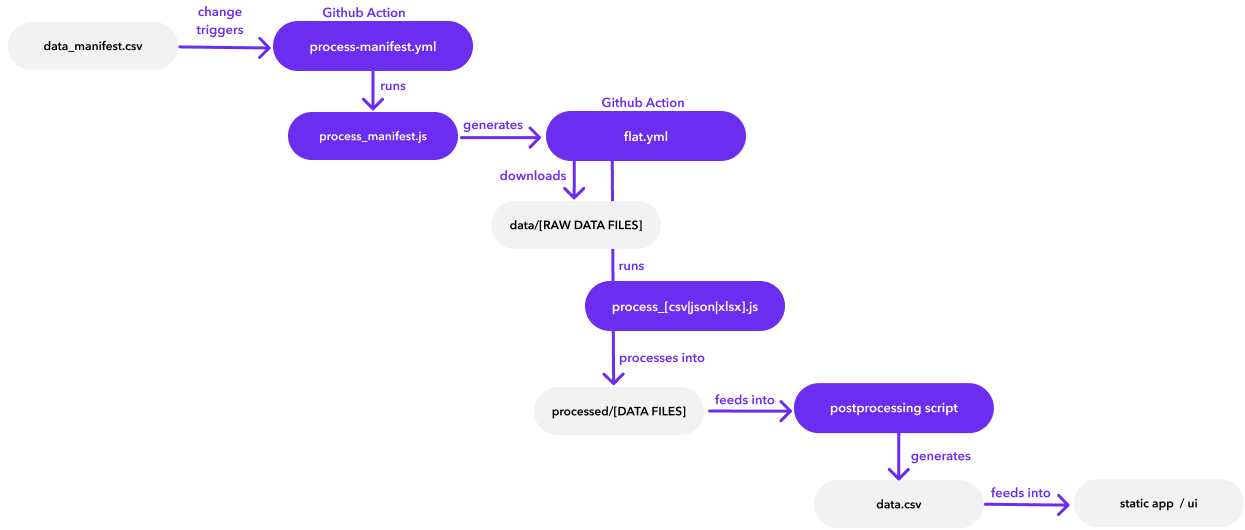
99 percent of all indicators are automatically updated when organisations release new reports and datasets. The below diagram visualises how updates in the source data triggers a change in the Compass webpage.

Figure 4. Source
When any of the links to source data expire, an automated email notification is sent to administrators, and new links are updated manually.
3. Score calculation methodology
The Digital Development Compass aims to put countries into one of the five maturity levels for each of the sub-pillars. This section includes the approach to normalization, weighting indicators and imputation of missing scores.
Normalisation
The indicators used within the compass have been normalized using Min-Max rescaling.
Min-Max rescaling
The following formula creates a score between 0 and 1. It does so by creating a scale with a maximum possible score of 1 that corresponds to the highest scoring country’s score; and a minimum possible score of 0 that corresponds to the lowest scoring country’s score.

Scaling and normalization of categorical data
The categories are identified in the dataset and numerical values are assigned to each category. Each category has a unique numerical representation. The maximum possible value that a category can attain within the dataset is determined to establish the scaling range. The maximum value provides a reference point for rescaling all other values. Once the maximum possible value is determined, the numerical values of the categories are rescaled to a predefined range, typically spanning from 0 to a chosen maximum value. This rescaling process ensures uniformity and facilitates comparison across different indicators.
The original numerical values of the categories to the desired rescaled range are linearly mapped. The mapping maintains the relative order and spacing of the original values.
For each category, its rescaled value is calculated using the determined maximum possible value and the chosen scaling range. The rescaling formula is consistently applied across all categories.
The rescaled values are normalized to ensure they fall within a standard range, such as 0 to 1. Normalization helps mitigate the influence of outliers and enhances the interpretability of the data. Min-Max normalization is used for normalization of these data types as well.
Indicator weightings
In the Compass, equal weightings are assigned to all pillars and sub-pillars.
Weighting at the indicator level is made in the following way:
- Indicator specificity: Each indicator is assigned a score of 1 or 0.5 based on its relationship with digital development:
- The score 0.5 is assigned to indicators identified as more weakly aligned and which only partially relate to digital development.
- The score 1 is assigned to indicators that have a clear, direct connection to digital development.
- A score of 0 is not included, as the data evaluation process already removed indicators that do not clearly relate to digital development (and which would have scored 0).
- Indicator uniqueness or overlap: Although the Compass does not have any instances of the same indicator appearing more than one time (explicit double counting), in some cases, multiple indicators are measured with overlapping factors. For instance, ‘average fixed broadband download speeds’ and ‘average mobile broadband upload speeds’ are highly likely to be correlated, being dependent on the same infrastructure. These indicators needed to be scored lower to avoid counting the same metric more than once.
- To quantitatively capture overlapping, indicators are scored by dividing 1 by the number of overlapping indicators.
- In this way, an indicator that does not overlap with others scores 1; an indicator that overlaps with only one other indicator scores 1/2 = 0.5; an indicator that overlaps with two other indicators scores 1/3 = 0.33, and so on.
- This process allows us to assign a lower score to those indicators that measure similar aspects of digital development.
- Indicator number: Indicator scores are divided by the total number of indicator scores within a sub-pillar.
Imputing scores
For indicators where there are gaps in country data, or there is no collected data from a particular country, imputing scores is an option. While imputed data is not included into the scoring in the Digital Development Compass, users can still visualise the data with or without imputed scores using a toggle switch.
The following imputation methods are selected depending on their suitability within a given context:
- Linear interpolation: Historical information can be used before implementing a modelling-based approach. If data are missing but there are values in preceding and subsequent years, linear interpolation is used.
- Extrapolation: If there is no data from preceding and subsequent years, data are extrapolated as a constant value of the nearest reported data, or as a value on a trend line/curve.
- Neighbouring/similar countries’ data: A mean average is taken based on a sample of regionally neighbouring countries and/or GDP figures.
- Expectation-maximisation with a bootstrapping (EMB): The remaining missing data are imputed with an expectation-maximisation with a bootstrapping (EMB) multiple imputation algorithm.
The EMB method generates imputed values through an iterative procedure that uses other variables to impute a value (expectation) and then asserts whether the value is most likely to fit the data (maximisation). To account for variation caused by missing data, the model is run 10 times. The average of these 10 imputations is then used to impute the missing value.
Definitions and scales
Data that has been retrieved are then matched with a UN-defined list of countries, regions, sub-regions, income groups and territorial borders.
Raw data and data from other indexes are converted to values within the Compass’ 0 - 5 range. The method used to perform this conversion depends on the type of indicator. Through rescaling all scores between 0 and 5 (no zero scores), the countries are clearly within one of the five maturity stages of digital development.
| Pillar | Basic | Opportunistic | Systematic | Differentiating | Transformational |
|---|---|---|---|---|---|
| People | Limited exposure: Cultural aversion, minimal tech use. | Limited literacy: Digital gap, basic use. | Growing acceptance: Basic literacy, more complex tasks. | Technology embraced: Reduced gap, high literacy. | Digital society: No gap, tech ingrained in society. |
| Sub-pillar | Basic | Opportunistic | Systematic | Differentiating | Transformational |
| Skills and literacy | Elite: Educated, skilled minority. Digital divide persists. | Private: Basic skills, some schools, company training. | Elective: Basic skills widespread, optional school learning. | Cultivated: Schools teach, tech equipped curriculum. | Widespread: Universal skills, adult centers, industry shift, integrated education. |
| Usage and adoption | Basic: Tech for leisure, low access and adoption. | Transactional: Moderate use, gaps in access. | Intermediate: Complex actions, info access, tech ownership. | Advanced: Complex services, reduced divide. | Proficient: Comprehensive, universal access, reduced divide. |
| Cultural norms | Resistant: Low tech adoption, change incentives lacking. | Tolerant: Tech as last resort. | Accepting: Trial-error, active use, known channels. | Enthusiastic: Open, innovative, motivated tech adoption. | Advocating: Full tech integration, societal reshaping. |
| Civic engagement | Restricted: Tech not for citizen-govt interaction, voice exclusion. | Volunteerism: Tech aids activism, accountability via volunteers. | Community: Tech solves local issues, citizen decision influence. | Engaged: Tech shapes decisions, ethics guide communication. | Participative: Integrated civic platforms, inclusive discourse, media outlets, encouraged participation. |
| Pillar | Basic | Opportunistic | Systematic | Differentiating | Transformational |
| Connectivity | Outdated connectivity, exclusion risk. | Basic quality, limited access. | Growing access, exclusion gaps. | Affordable, open access. | Universal broadband, equal access. |
| Sub-pillar | Basic | Opportunistic | Systematic | Differentiating | Transformational |
| Physical infrastructure | Outdated: Limited coverage, unreliable infrastructure. | Inaccessible: Basic quality, selective coverage. | Rudimentary: Urban-focused high-speed coverage. | Convenient: Extended, reliable, majority covered. | Extensive: Universal, high quality, reliable services. |
| Access enablers | Blocked: Systemic barriers exclude at-risk groups. | Restricted: Lower tech access, systemic barriers. | Limited: Consistently lower access, ignored differentiation. | Open: Similar access, recognized barriers, free access points. | Universal: Equal access, acknowledged barriers, full benefits. |
| Pillar | Basic | Opportunistic | Systematic | Differentiating | Transformational |
| Government | Limited: Paper bureaucracy, no funding, ad-hoc tech. | Initiatives in silos, limited support, no strategy. | Shared vision, limited funds, strategic planning. | Embedded, administrative integration, emerging tech. | Optimized, innovative, legislative backing, data-driven. |
| Sub-pillar | Basic | Opportunistic | Systematic | Differentiating | Transformational |
| Leadership and strategy | Reactive: No strategy, no senior support, isolated projects. | Informal: Scattered support, no national framework. | Formal: Underdeveloped plan, moderate priority. | Strategic: Inclusive vision, some shared adoption. | Visionary: Impactful strategy, top-level support, empowered leaders. |
| Implementation capacity and systems | Analogue: No skills, outsourcing, no strategy, no budget. | Outsourcing: Few skills, external help, partial strategy. | Digital seeds: Growing skills, some insourcing, developing strategy. | Integrated: Widespread skills, central strategy, metrics-driven. | Digital by default: Embedded skills, centralized strategy, quantifiable objectives, long-term budget, full Digital Principles integration. |
| Digital public services and platforms | Paper-based: No online services, in-person only. | Digitization: Basic digital tools, in-person main. | Digitalization: Online transactions, some redesign. | Integrated digitalization: Centralized, redesigned, data-centric. | Smart State: Online access, optional in-person, full redesign. |
| Open government | Closed: No info sharing, no feedback or evaluation. | Reactionary: Limited sharing, key stakeholder input. | Transparent: Regular info sharing, some stakeholder input. | Participatory: Info sharing, broad input, partial KPIs. | Collaborative: Open, stakeholder partnership, robust feedback, evaluations. |
| Pillar | Basic | Opportunistic | Systematic | Differentiating | Transformational |
| Regulation | Initial stage. Non-digital laws apply. | Formative: Digital laws developing. | Established: Substantive digital laws, weak enforcement. | Advanced: Substantive laws, strong enforcement. | Dynamic: Strong laws, justice, formal intl. cooperation. |
| Sub-pillar | Basic | Opportunistic | Systematic | Differentiating | Transformational |
| Data protection | No recognition: No data protection, access barriers. | Regulate & forget: Ineffective legislation, no enforcement. | Recognition: Functional data protection authority, regulation. | Promotion: Key data rights protected, enforced. | Dynamic Legal Framework: Enforced tailored regulation, FOI used, accessible government data. |
| Emerging technologies | No recognition: Tech not policy consideration. | Regulate & forget: Uniform reg., no impact assessment. | Recognition: Discuss need to regulate tech impact. | Promotion: Actively promotes growth, updates. | Dynamic Legal Framework: Evolving, outcome-based, feedback loops, soft law mechanisms. |
| Fair market competition | No recognition: No IP law, static taxation, telecom monopoly. | Regulate & forget: Outdated IP law, some competition. | Recognition: Licensing promotes competition, balanced prices. | Promotion: Adaptive taxation, national IP protection. | Dynamic Legal Framework: Anti-monopoly, IP protection, flexible dispute resolution. |
| Cybersecurity | No recognition: No cyber crime law, unprotected infrastructure. | Regulate & forget: Developing law, seeking resources. | Recognition: Enacted law, limited enforcement. | Promotion: Budget support, growing practice. | Dynamic Legal Framework: Comprehensive law, baselines, compliance, international alignment. |
| Consumer protection | No recognition: Digital service monopolies. | Regulate & forget: Limited watchdog, partial monopoly. | Recognition: Price monitoring, accessibility. | Promotion: Functional watchdog, diverse licenses. | Dynamic Legal Framework: Strong watchdog, tailored legislation, price monitoring. |
| Human rights | Not recognized: No digital human rights. | Recognized: No action taken. | Regulated: Focus on political rights. | Resourced: Legal resources, intl. standards. | Fully protected: Legal, institutional, tech safeguards. |
| Pillar | Basic | Opportunistic | Systematic | Differentiating | Transformational |
| Economy | Limited integration: Traditional finance, low tech business. | Growing tech: Digital finance, moderate tech business. | Cross-sector collab: Seed financing, wide tech business. | Coordinated digital: Inclusive ecosystems, efficient tech. | Digital industry: Responsibility standards, widespread models. |
| Sub-pillar | Basic | Opportunistic | Systematic | Differentiating | Transformational |
| Business | Adverse: Limited tech adoption, unfavorable conditions. | Developing: Moderate tech, sector-specific conditions. | Favorable: Wide tech, improved conditions for all sectors. | Ecosystem formation: Majority use tech, coordinated policies. | Ecosystem integration: Tech integrated, cooperative networks. |
| Financial services | Emerging: Primarily physical access to financial services. | Developing: Early adopters introduce basic digital services. | Strategic: Established digital services, essential for finance. | Market leading: Mature digital financial services, market focus. | People leading: Inclusive finance, public-private finance for the vulnerable. |
| Innovation ecosystem | Stagnant: Limited graduates, outdated curriculum, lack of engagement. | Emergent: Improved communication, industry-academia ties, updated curriculum. | Siloed: Growing collaboration, international recognition. | Interconnected: Extensive engagement, cross-sector collaboration, international events. | Dynamic: Thriving ecosystem, comprehensive collaboration, strong IT career path, global ties. |
| Standards of responsibility | Unaware: Lack of awareness about digital standards in digital services. | Cognizant: Awareness but limited action on ethical standards. | Compliant: Minimum ethical compliance, external constraint view. | Practitioner: Accountability, privacy-centric design, transparency. | Advocate: Embedded ethics, evolving standards, proactive advocacy. |
| Pillar | Basic | Opportunistic | Systematic | Differentiating | Transformational |
| Digital Public Infrastructure | Paper IDs, traditional payments, siloed data. | Basic IDs, early digital payments, limited sharing. | Digital IDs, mobile banking, online data sharing. | Integrated IDs, digital wallets, accessible data. | Beneficial ID/banking, widespread payments, open data. |
| Sub-pillar | Basic | Opportunistic | Systematic | Differentiating | Transformational |
| Payments | Traditional: Cash, checks dominate, rare digital payments. | Changing: Digital access, cards, online banking, cashless. | Systematic: Prepaid, mobile money, no bank account. | Differentiating: Decoupled payments, digital wallets. | Transformational: Widespread digital payments, local currencies. |
| Identification | Paper-based: Birth, marriage, land records on paper. | Digitized: Records digital, separate institutions. | Digitalized: Machine-readable records, workflows set. | Integrated: Govt-business linked IDs, data protection. | Federated: Inclusive system, citizens/businesses/entities. |
| Data exchange | Offline: No data exchange, paper-based, no systems. | Siloed: Limited exchange, spreadsheets, PDFs. | Online: Central data, info systems, infrastructure. | Accessible: Governance, data use, decision-making. | Open: Optimized model, public data, structured API. |
Table 3. DDC definitions and scales